Onchain Highlights
DEFINITION: This metric aims at giving an estimate for the year-over-year change in the share of the Bitcoin supply to be held/traded in Asia.
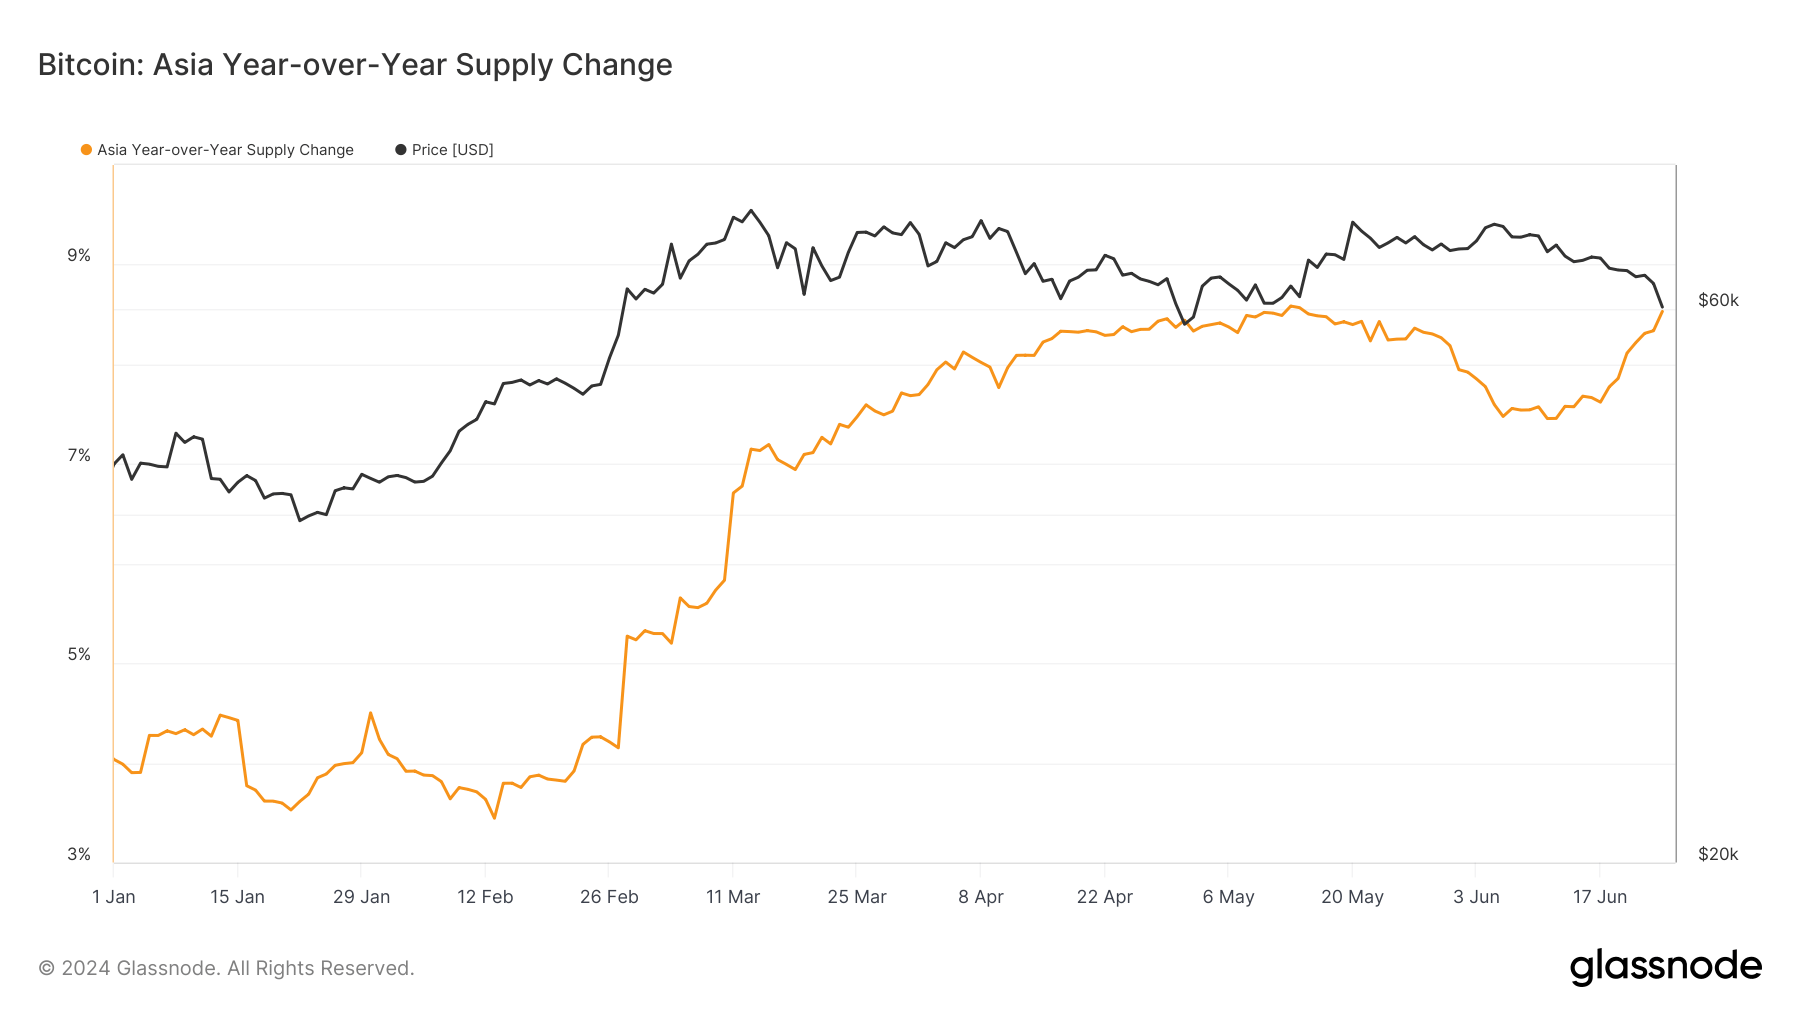
Bitcoin’s year-over-year supply change in Asia has shown significant fluctuations in correlation with its price. Since January, the supply change in Asia has seen a sharp increase from approximately 4% to over 8% by mid-May, aligning with Bitcoin’s price rise to over $70,000. It dipped throughout the start of June but has since regained the 8% level. This trend suggests a growing accumulation of Bitcoin within the Asian market, potentially driven by increased trading activity and investor interest in the region even through the recent downturn.

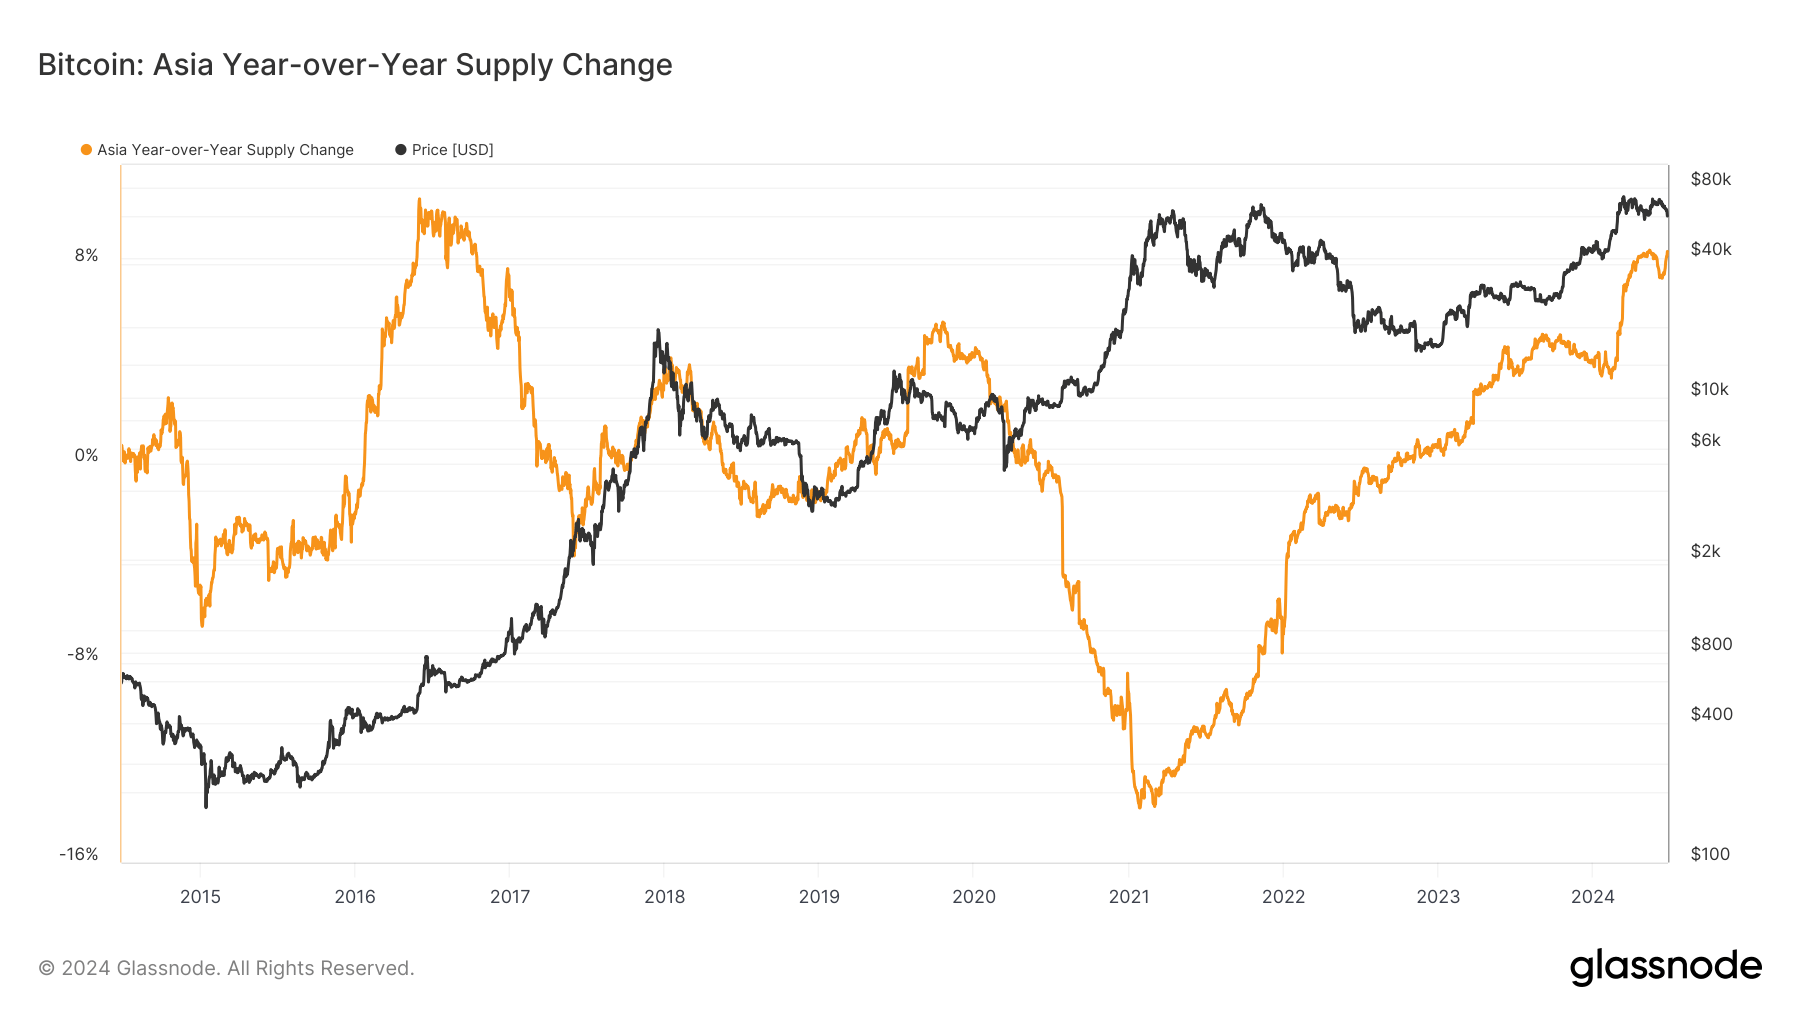
Historically, the Asian market has played a pivotal role in influencing Bitcoin’s price trends. The long-term chart indicates a notable pattern where periods of high supply change often coincide with major price movements. For instance, during the 2017 bull run, a similar surge in supply change was observed, followed by the significant price appreciation. The recent data mirrors this historical trend, indicating a possible continuation of this pattern in 2024.
Interestingly, the 2020-2021 bull run broke this trend, with Asia selling into the top of the market, whereas in 2016, they sold as Bitcoin ran up towards its 2017. In fact, in 2021, the supply change went negative for the first time since Glassnode records began.
While accumulation also occurred in late 2017, the supply change has never retaken its 10% peak from 2016. Currently, the Asia supply change is closer to the top than it has been in over eight years.
This ongoing increase in Bitcoin supply held in Asia reflects the region’s enduring impact on the digital assets market. As investor sentiment and market conditions evolve, the Asian market’s influence on Bitcoin’s supply and price movements remains a critical factor to monitor.

The post Bitcoin supply in Asia doubles, mirroring 2017 bull run pattern appeared first on CryptoSlate.

إرسال تعليق