Since Ethereum moved from proof-of-work to proof-of-stake in 2022, it has become a deflationary asset. The total circulating supply of Ethereum (ETH) currently stands at 120,105,358 ETH, representing a 415,680 ETH decrease from the supply levels observed before The Merge.
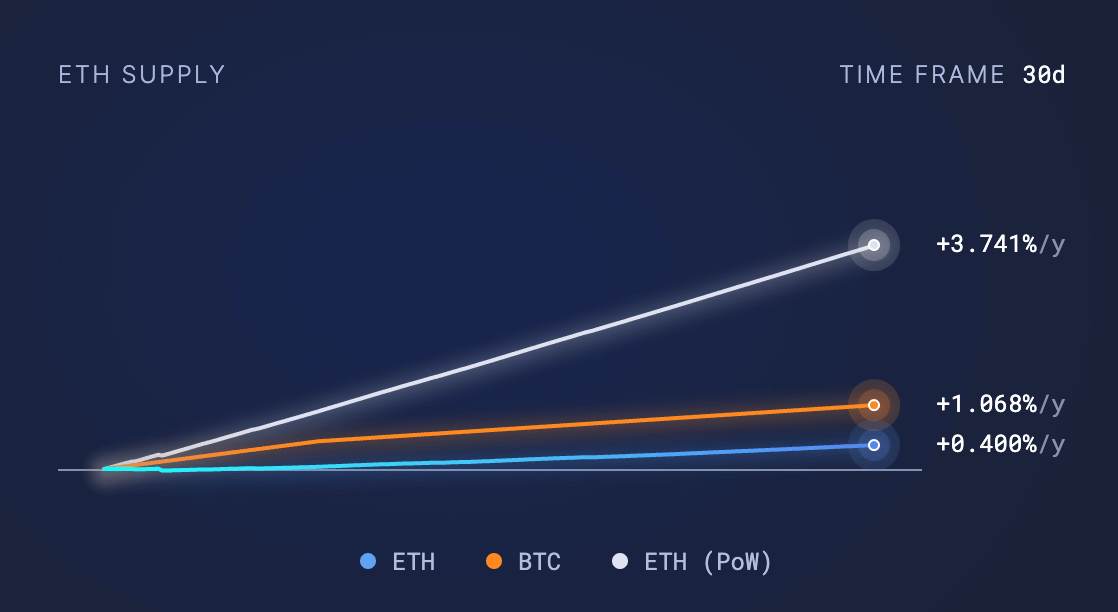
However, over the past 30 days, Ethereum’s supply dynamics have shifted, with 35,548.72 ETH being burned (removed from circulation) and 75,072.43 ETH being issued as block rewards to validators. The net result is a supply increase of 39,523.71 ETH during this period. Data from Ultrasound Money show that, based on the supply change over the past 30 days, Ethereum’s current annualized inflation rate is approximately 0.4%.

In comparison, Bitcoin’s inflation rate stands at 1.068%, while Ethereum’s Proof-of-Work (pre-merge) inflation rate would have been significantly higher at 3.74%. If the current 30-day rate persists, projections for the next year indicate that around 433,000 ETH will be burned, and 914,000 ETH will be issued, creating a net gain of 481,000 ETH.
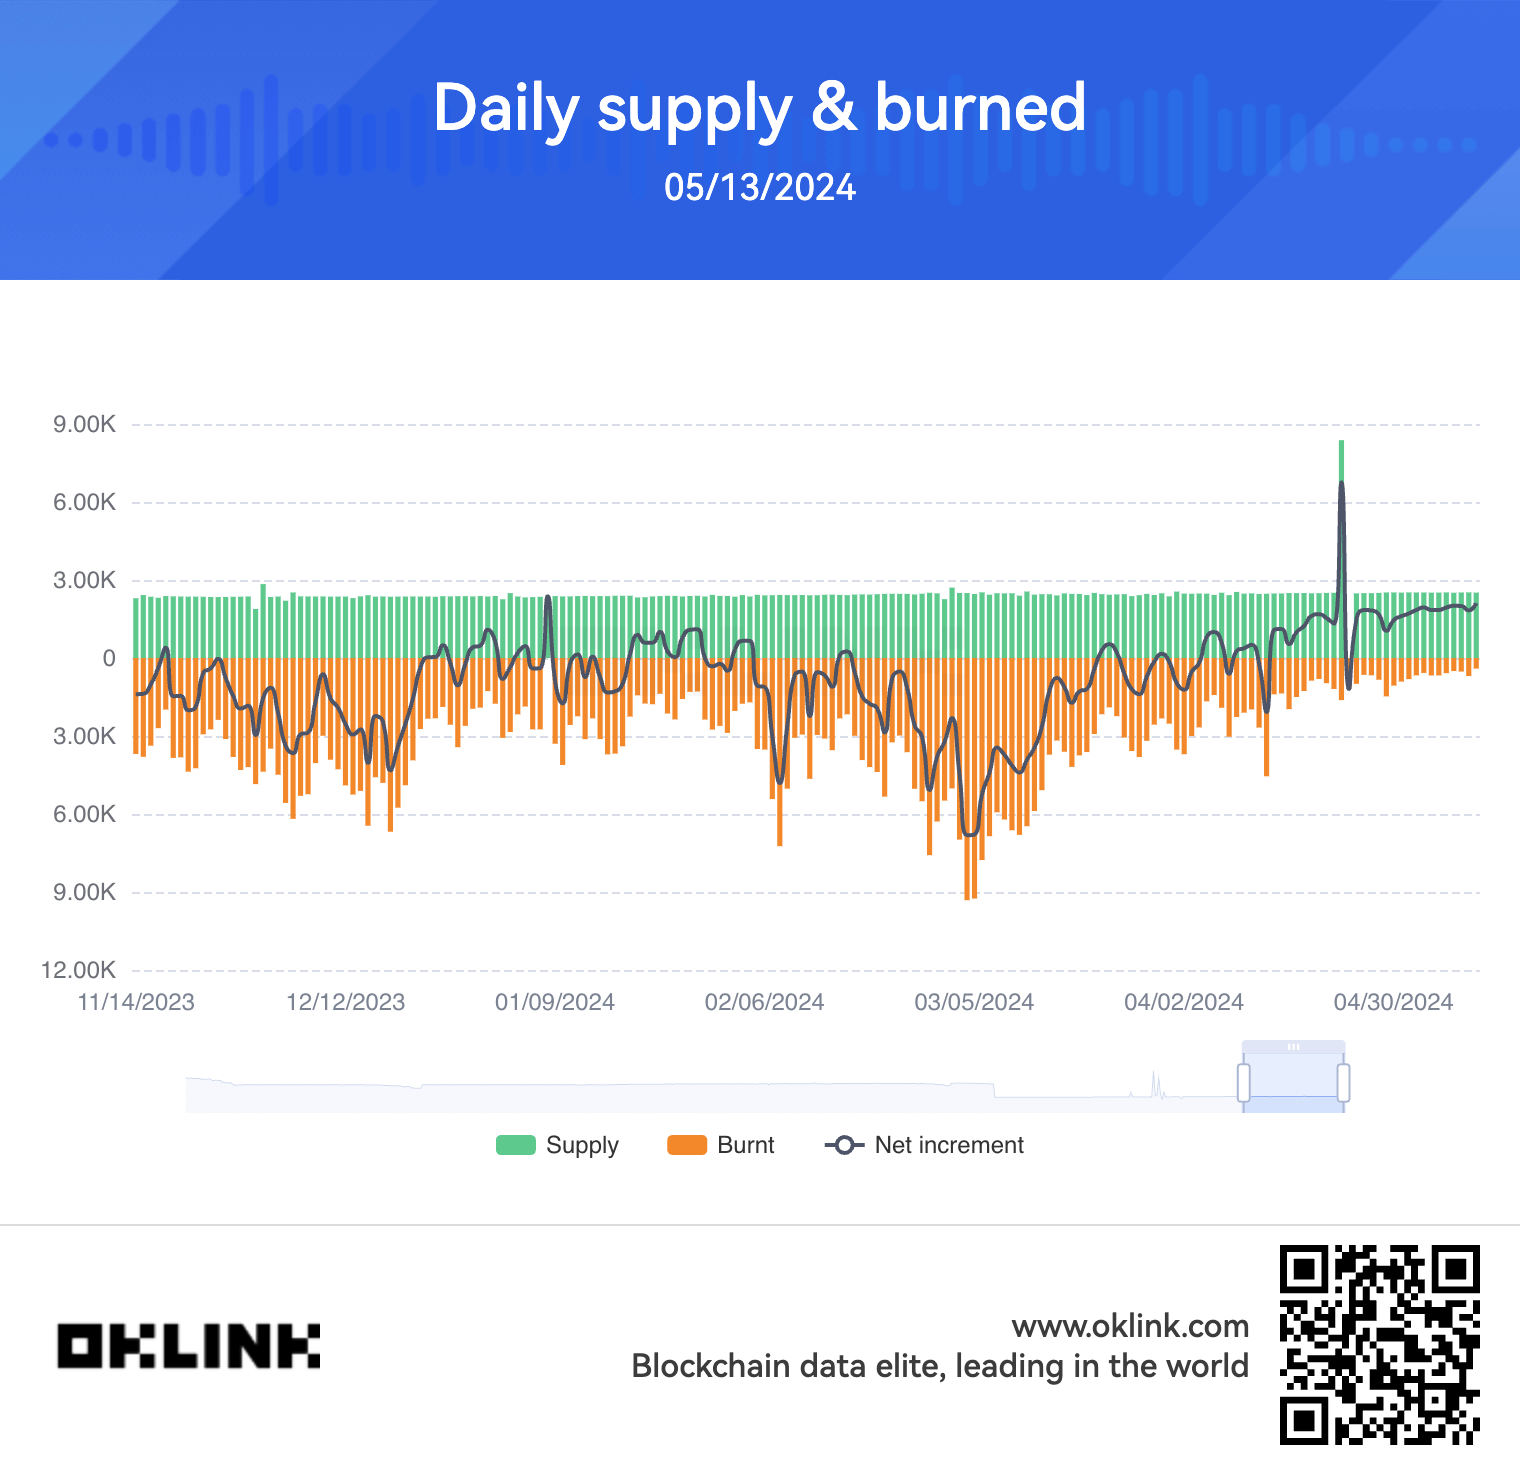
Data from OKLink shows a continued decrease in ETH burned since March, when an average of around 6,000 ETH was burned daily. Since the start of May, only around 900 ETH has been burned daily, the lowest average levels since The Merge.

The recent Dencun upgrade on the Ethereum network has had a notable impact on the ecosystem. The upgrade has led to a decrease in layer-2 transaction fees and overall network activity. Consequently, this has seemingly resulted in a lower burn rate, pushing Ethereum’s supply back into an inflationary state.
Data from Etherscan and Ycharts shows that gas fees have also plummeted to around 5 gwei, the lowest on record.

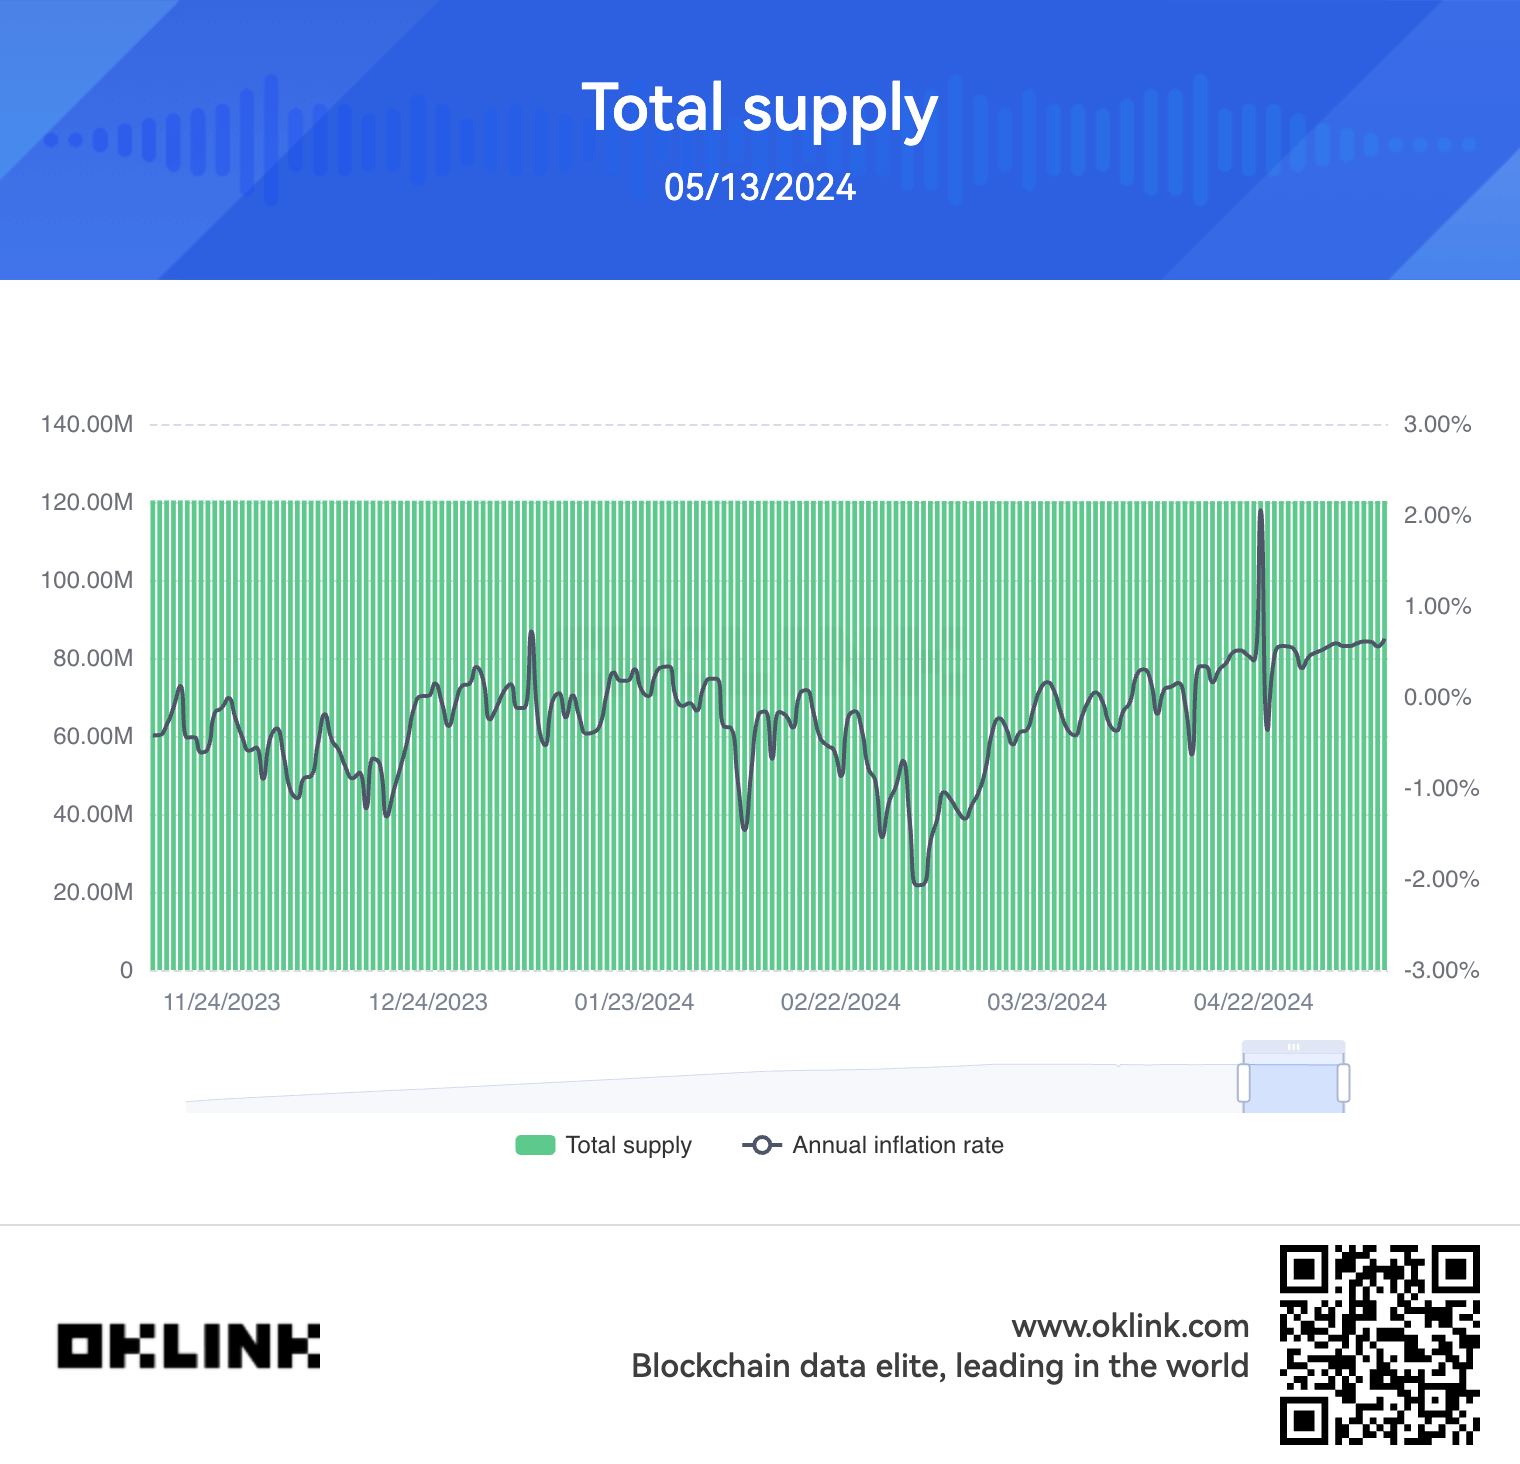
Interestingly, Ethereum’s inflation rate has drawn closer to that of Bitcoin, especially in the aftermath of Bitcoin’s halving event last month. As per data from the past 7 days, Ethereum’s inflation rate for the past week stands at 0.54%, just 0.29 percentage points higher than Bitcoin’s post-halving rate of 0.83%.
Ethereum’s inflation rate has been steadily increasing since February when it reached a local low of -2%.

While Ethereum’s supply has become slightly inflationary in the short term due to reduced network activity and burn rate, its overall supply is still decreasing on a net basis. This can be attributed to EIP-1559, which introduced a burn mechanism for a portion of transaction fees.
Looking ahead, Ethereum’s inflation rate and supply dynamics will likely be influenced by future network upgrades and adoption trends. If transaction fees and burn rate remain low, Ethereum may continue to experience inflationary pressure in the near term. However, the long-term trajectory will depend on the success of upcoming upgrades and the overall growth of the Ethereum ecosystem.
The adoption of layer-2 networks and the recent increase in layer-3 network activity reduces load from the Ethereum mainnet, yet it does so at a cost. However, the current increase in L2 and L3 activity is not at a level to create sufficient L1 transactions to keep Ethereum deflationary. Only time will tell whether the ultra-sound money concept for Ethereum will be retained in a world dominated by L2 and L3s.
The post Ethereum has been increasingly inflationary for over a month as fees hit all-time low appeared first on CryptoSlate.

Post a Comment